
AutoFigureEdit: Research Text to Modifiable Vector Figures
Turn methodology sections from academic papers into fully modifiable SVG diagrams — camera-ready scientific figures you can customize element by element.
Powered by LLM drafting, SAM3 component detection, and automatic vector conversion. Published at ICLR 2026.

Give AutoFigureEdit a Try
See the auto figure edit pipeline in action. Drop in your methodology text, optionally attach a reference image for style matching, and watch AutoFigureEdit build a camera-ready modifiable SVG diagram for you. The tool handles methodology visualizations, system overviews, process flowcharts, and more -- all derived from plain text and delivered as fully customizable vector artwork.
tip: concise, structured method text yields cleaner templates
tip: upload a figure from a paper you like to transfer its visual style
No Images Generated
FigureBench Results
Validated on FigureBench — the first large-scale scientific illustration generation benchmark with 3,300 samples from papers, blogs, surveys, and textbooks.
3,300 Benchmark Samples
Benchmark Samples
1.7k GitHub Stars
GitHub Stars
ICLR 2026 Published At
Published At
MIT Open Source License
Open Source License
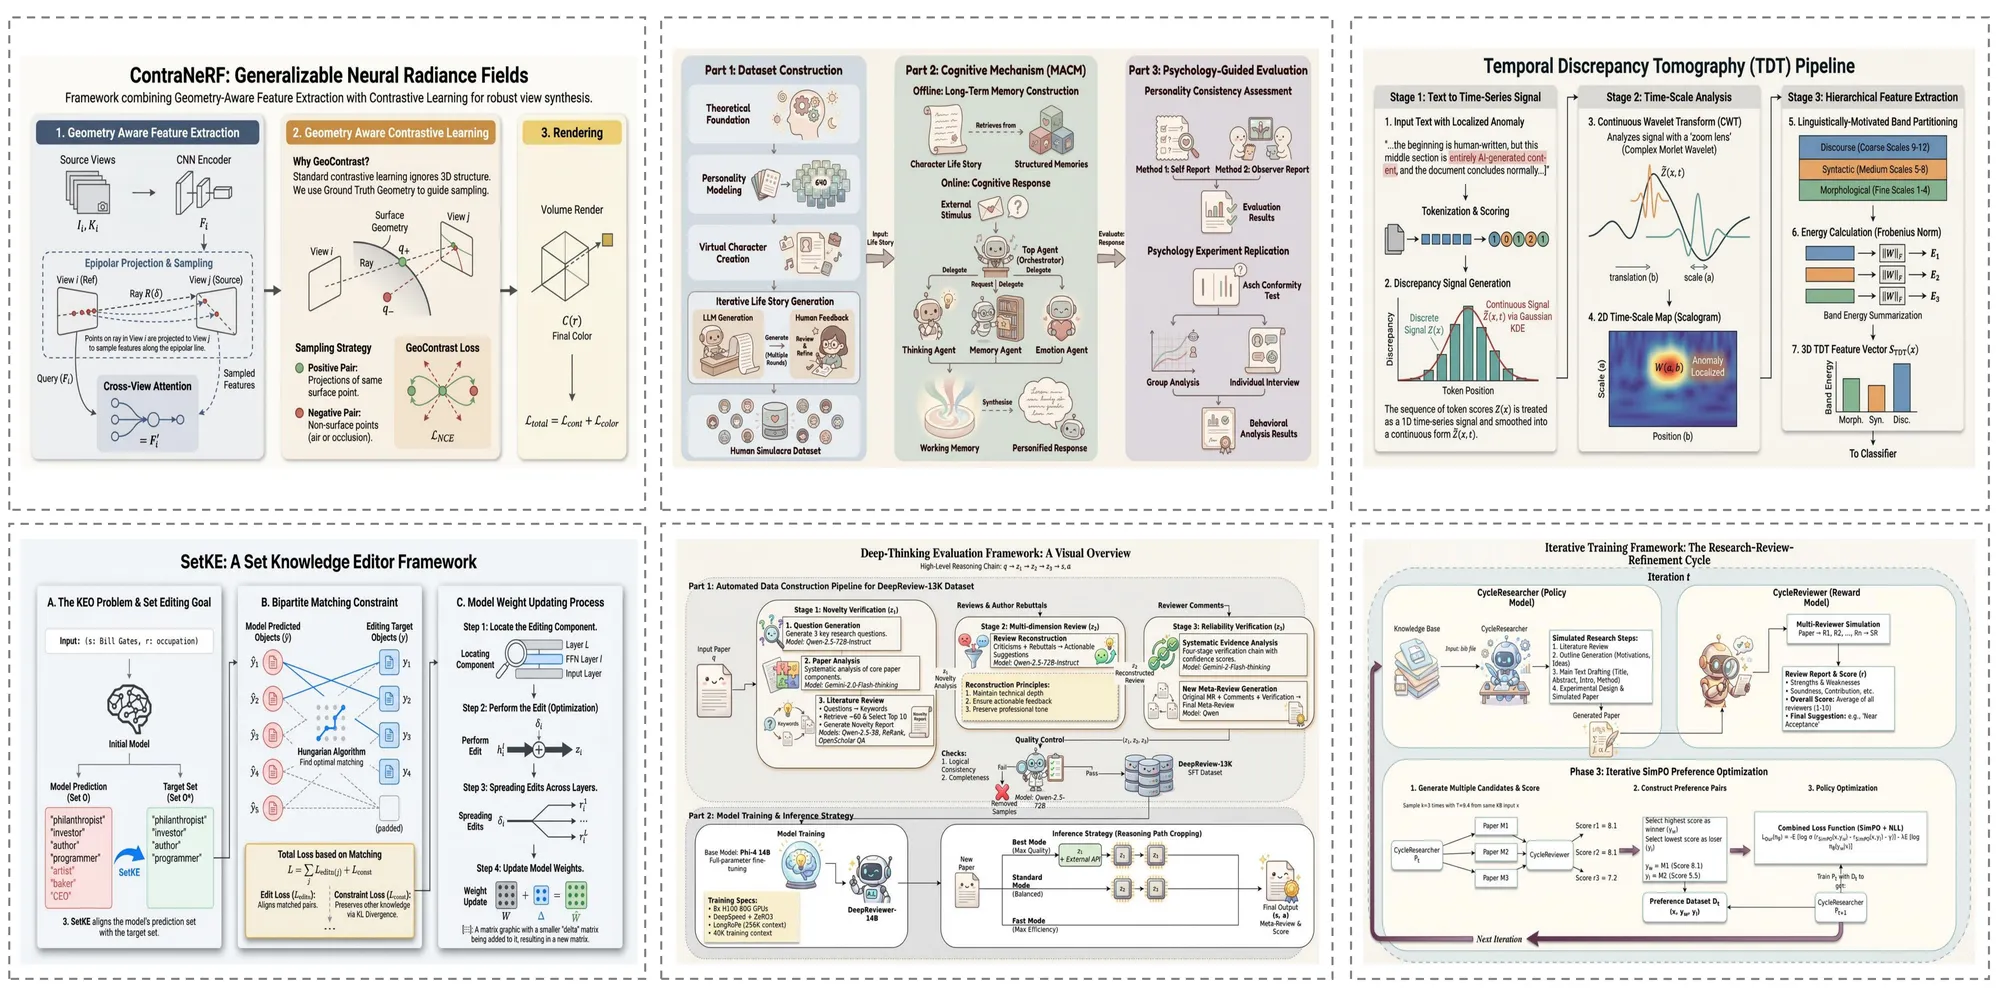
AutoFigureEdit Showcase
Browse a curated collection of what the auto figure edit system can produce -- spanning methodology visualizations, system overviews, and beyond. Each sample was created through the four-stage AutoFigureEdit pipeline straight from paper text, yielding fully customizable SVG results.
Research Paper Figures
AutoFigureEdit builds camera-ready methodology visualizations straight from your research manuscript. Whether it involves intricate model designs, sequential processing stages, or encoder-decoder setups, the auto figure edit pipeline renders them as fully customizable SVG diagrams complete with precise geometry, labeled connections, and clear annotations -- ideal for top-tier venue submissions.
Survey Paper Overviews
When you need to visualize an entire research landscape, AutoFigureEdit produces detailed taxonomy and comparison charts that map relationships between multiple approaches. These auto figure edit outputs help readers rapidly understand a field's structure through organized visual hierarchies and uniform styling.
Technical Blog Graphics
Beyond formal publications, the auto figure edit pipeline works equally well with informal technical writing. Blog posts covering machine learning ideas, coding tutorials, or engineering explanations are turned into clean, visually engaging diagrams that simplify complex topics for wider audiences.
Educational Material Illustrations
AutoFigureEdit creates textbook-grade illustrations that communicate fundamental concepts with clarity. From neural network layouts and data pipeline charts to biological process flows, these auto figure edit outputs are well-suited for lecture decks, course handouts, and textbook chapters.
The Challenge AutoFigureEdit Addresses
Producing publication-grade scientific diagrams has long been a major time sink for researchers -- the auto figure edit pipeline automates the entire workflow while preserving full editability.
Tedious Manual Figure Creation
Academics routinely invest hours or entire days assembling figures in PowerPoint, Illustrator, or LaTeX tikz -- valuable time that the auto figure edit pipeline can reclaim through automation.
Locked-Down AI-Generated Images
Current AI image tools produce flat raster files with no editing capability -- a single tweak forces you to start over from scratch. AutoFigureEdit resolves this by delivering modifiable SVG output through the auto figure edit process.
Mismatched Visual Styles
Keeping a unified visual identity across every figure in a publication is notoriously difficult without style matching capabilities. AutoFigureEdit tackles this through reference-guided style transfer in the auto figure edit pipeline.
Breakthrough Contributions of AutoFigureEdit
AutoFigure-Edit brings several pioneering advances to automated scientific illustration creation, presented at ICLR 2026.

Under the Hood: The 5-Stage Auto Figure Edit Pipeline
AutoFigureEdit converts scientific text into modifiable SVG diagrams via a 5-stage pipeline. Every stage feeds into the next, progressively transforming raw text into a fully customizable, camera-ready vector illustration.
Stage 1: Raster Drafting
A vision-language model (Gemini 3.1 Flash) processes your methodology text alongside an optional reference image, then creates an initial raster draft (figure.png). The model understands conventions of scientific figures and translates textual methodology into a coherent visual layout.
Stage 2: SAM3 Component Detection
Segment Anything Model 3 (SAM3) identifies and segments distinct visual components -- icons, label areas, connectors, shapes -- guided by structured prompts such as 'icon, person, robot, animal'. The output includes bounding boxes with confidence scores and a detection map (samed.png).
Stage 3: SVG Framework Generation
Taking the original figure, detection mask, and bounding box metadata as multimodal inputs, the LLM (Gemini 3.1 Pro) assembles a placeholder-based SVG whose regions correspond to labeled components. RMBG-2.0 strips backgrounds from cropped icons to yield transparent assets.
Stage 4: Composite Assembly
The system harmonizes coordinate systems between the SVG framework and the source figure, then swaps placeholders with transparent icons obtained from the detection stage. The result is the assembled SVG (final.svg) with every component as an independently modifiable vector element.
Stage 5: Iterative Polishing
An optional refinement stage carries out iterative SVG improvements -- path optimization, stroke recognition, and layout adjustments. Users can additionally polish results using the auto figure edit integrated svg-edit canvas with drag-and-drop composition, completing the text-to-modifiable-SVG workflow.
Questions & Answers
Everything you need to know about how AutoFigureEdit works.
Create Camera-Ready Figures in Minutes
Stop spending hours on manual diagrams. Generate publication-quality SVG figures from your methodology text with full editability — no design skills required. Start free with instant results.