
AutoFigureEdit:学術論文の図版を知的に生成し自由に編集
学術論文の方法論セクションを完全に変更可能なSVGダイアグラムに変換します — 要素ごとにカスタマイズできる出版対応の科学図版。
LLMによる初稿生成、SAM3コンポーネント検出、自動ベクター変換を搭載。ICLR 2026で発表。
今すぐAutoFigureEditを体験
こちらでAutoFigureEditのインテリジェントな図版生成を直接お試しいただけます。方法論テキストを貼り付け、必要に応じて参照画像をアップロードするだけで、出版基準を満たす編集可能なSVG学術イラストが自動生成されます。
ヒント:簡潔で構造化されたメソッドテキストがよりクリーンなテンプレートを生成します
ヒント:お好みの論文の図をアップロードして、そのビジュアルスタイルを転送できます
画像は生成されていません
FigureBench パフォーマンス
FigureBench で検証——論文・ブログ・サーベイ・教科書から 3,300 サンプルを収集した初の大規模学術イラスト生成ベンチマーク。
3,300 ベンチマークサンプル
ベンチマークサンプル
1.7k GitHub Stars
GitHub Stars
ICLR 2026 掲載
掲載
MIT オープンソースライセンス
オープンソースライセンス
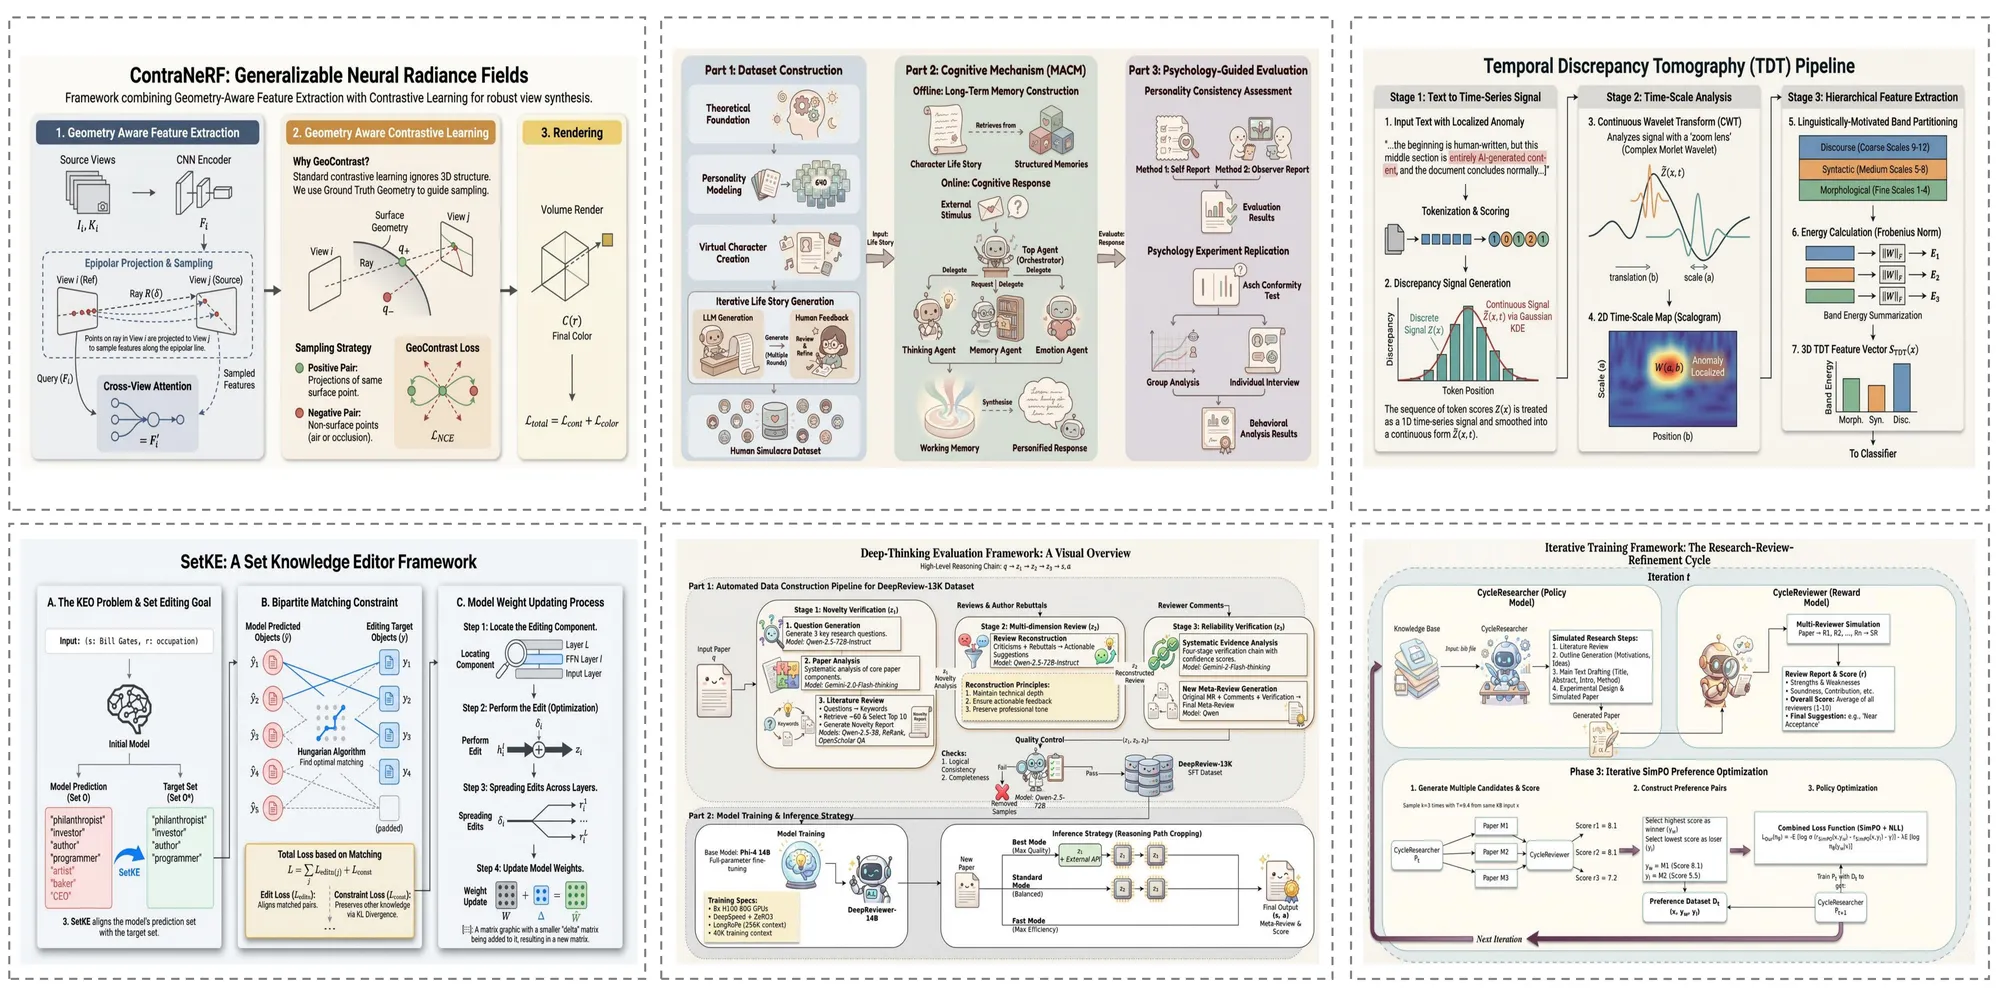
AutoFigureEdit 生成事例ギャラリー
AutoFigureEdit が多彩な学術分野で実際に生成した図版の事例集です。様々な複雑度の科学イラストへの対応力をご確認ください。
論文ケース
Auto Figure は研究論文のテキストから出版品質の方法論図を直接生成します。複雑なモデルアーキテクチャ、多段階パイプライン、エンコーダ・デコーダフレームワークを、精確な形状、コネクタ、ラベルを持つ完全に編集可能なSVGイラストとしてレンダリングします。
サーベイケース
サーベイ論文では、Auto Figure が複数の手法間の分類体系、関係、比較を捉えた包括的な概観図を作成します。生成された図は、明確な視覚階層と一貫したスタイリングで研究分野の全体像を素早く把握するのに役立ちます。
ブログケース
Auto Figure は非公式な技術文書にも対応します。機械学習の概念を説明するブログ記事から技術チュートリアルまで、複雑なアイデアをより幅広い読者に分かりやすく伝える、明瞭で視覚的に魅力的な図を生成します。
教科書ケース
教育コンテンツでは、Auto Figure が基礎概念を明確に伝える教科書品質のイラストを生成します。ニューラルネットワークアーキテクチャ、データフロー図、生物学的プロセスなど、講義スライド、教材、教科書の章に適した図を生成します。
AutoFigureEditが解決するボトルネック
コード記述や数式導出におけるAIの進歩にもかかわらず、出版品質のイラスト作成は依然として手作業の災害領域です。
時間のかかる手作業
レイアウト、配置、配色の手動調整は、研究者の貴重な時間を何時間、場合によっては何日も消費します。
ハルシネーションのリスク
汎用生成モデル(例:DALL-E)は論理トポロジーやデータ精度において頻繁にエラーを生じます — 数値ハルシネーションです。
美的ギャップ
専門的でないデザイナーは、NeurIPS、ICML、ICLRなどのトップベニューが求めるビジュアルの美的要件を満たすことに苦労します。
Auto Figure の主要イノベーション
AutoFigureEdit-Edit は ICLR 2026 で発表された、科学イラスト自動生成における画期的な革新を導入しています。

システムアーキテクチャ:5段階パイプライン
Auto Figure は5段階のパイプラインで科学テキストを編集可能なSVGイラストに変換します。
Stage 1: Raster Generation
A vision-language model (Gemini 3.1 Flash) reads your method text and optional reference image, then generates an initial raster draft (figure.png). The LLM understands scientific figure conventions and translates textual methodology into a visual composition.
Stage 2: SAM3 Segmentation
Segment Anything Model 3 (SAM3) detects and segments distinct components — icons, text regions, connectors, shapes — using structured prompts like 'icon, person, robot, animal'. Outputs bounding boxes with confidence scores and a segmentation map (samed.png).
Stage 3: SVG Templating
Using the original figure, segmentation mask, and box metadata as multimodal inputs, the LLM (Gemini 3.1 Pro) generates a placeholder-style SVG whose boxes align with labeled regions. RMBG-2.0 removes backgrounds from cropped icons to create transparent assets.
Stage 4: Final Assembly
The system aligns coordinate systems between the SVG template and original figure, then replaces placeholders with transparent icons extracted from segmentation. This produces the assembled SVG (final.svg) with all components as individually editable vector elements.
Stage 5: Iterative Refinement
An optional optimization stage performs iterative SVG refinement — path optimization, stroke recognition, and layout fine-tuning. Users can also refine the output in Auto Figure's built-in svg-edit canvas with drag-and-drop composition, completing the text-to-editable-SVG workflow.
よく寄せられるご質問
AutoFigureEditの機能や使い方についてユーザーから多く寄せられる質問と回答をまとめました。
論文テキストから出版品質の図版を数分で
AutoFigureEdit パイプラインで、方法論の記述を修正可能な SVG 科学図表に変換します。デザインスキルは不要です。