
AutoFigureEdit:一鍵打造可自由修改的學術配圖
將學術論文方法論章節轉換為完全可修改的 SVG 圖表——可逐元素自訂的出版級科研插圖。
基於 LLM 草稿生成、SAM3 組件偵測與自動向量轉換。發表於 ICLR 2026。
現在就來試試 AutoFigureEdit
在此處直接體驗 AutoFigureEdit 的智慧配圖生成效果。只需貼上方法論文字,還可上傳參考圖像以實現風格一致性,AutoFigureEdit 將為您產出符合出版標準的可編輯 SVG 學術插圖。
提示:簡潔、結構化的方法文本能生成更清晰的模板
提示:上傳您喜歡的論文配圖以遷移其視覺風格
沒有產生圖片
FigureBench 效能數據
經 FigureBench 驗證——首個大規模學術插圖生成基準測試,包含來自論文、部落格、綜述和教科書的 3,300 個樣本。
3,300 基準測試樣本
基準測試樣本
1.7k GitHub Stars
GitHub Stars
ICLR 2026 發表於
發表於
MIT 開源授權
開源授權
AutoFigureEdit 實際成果展覽
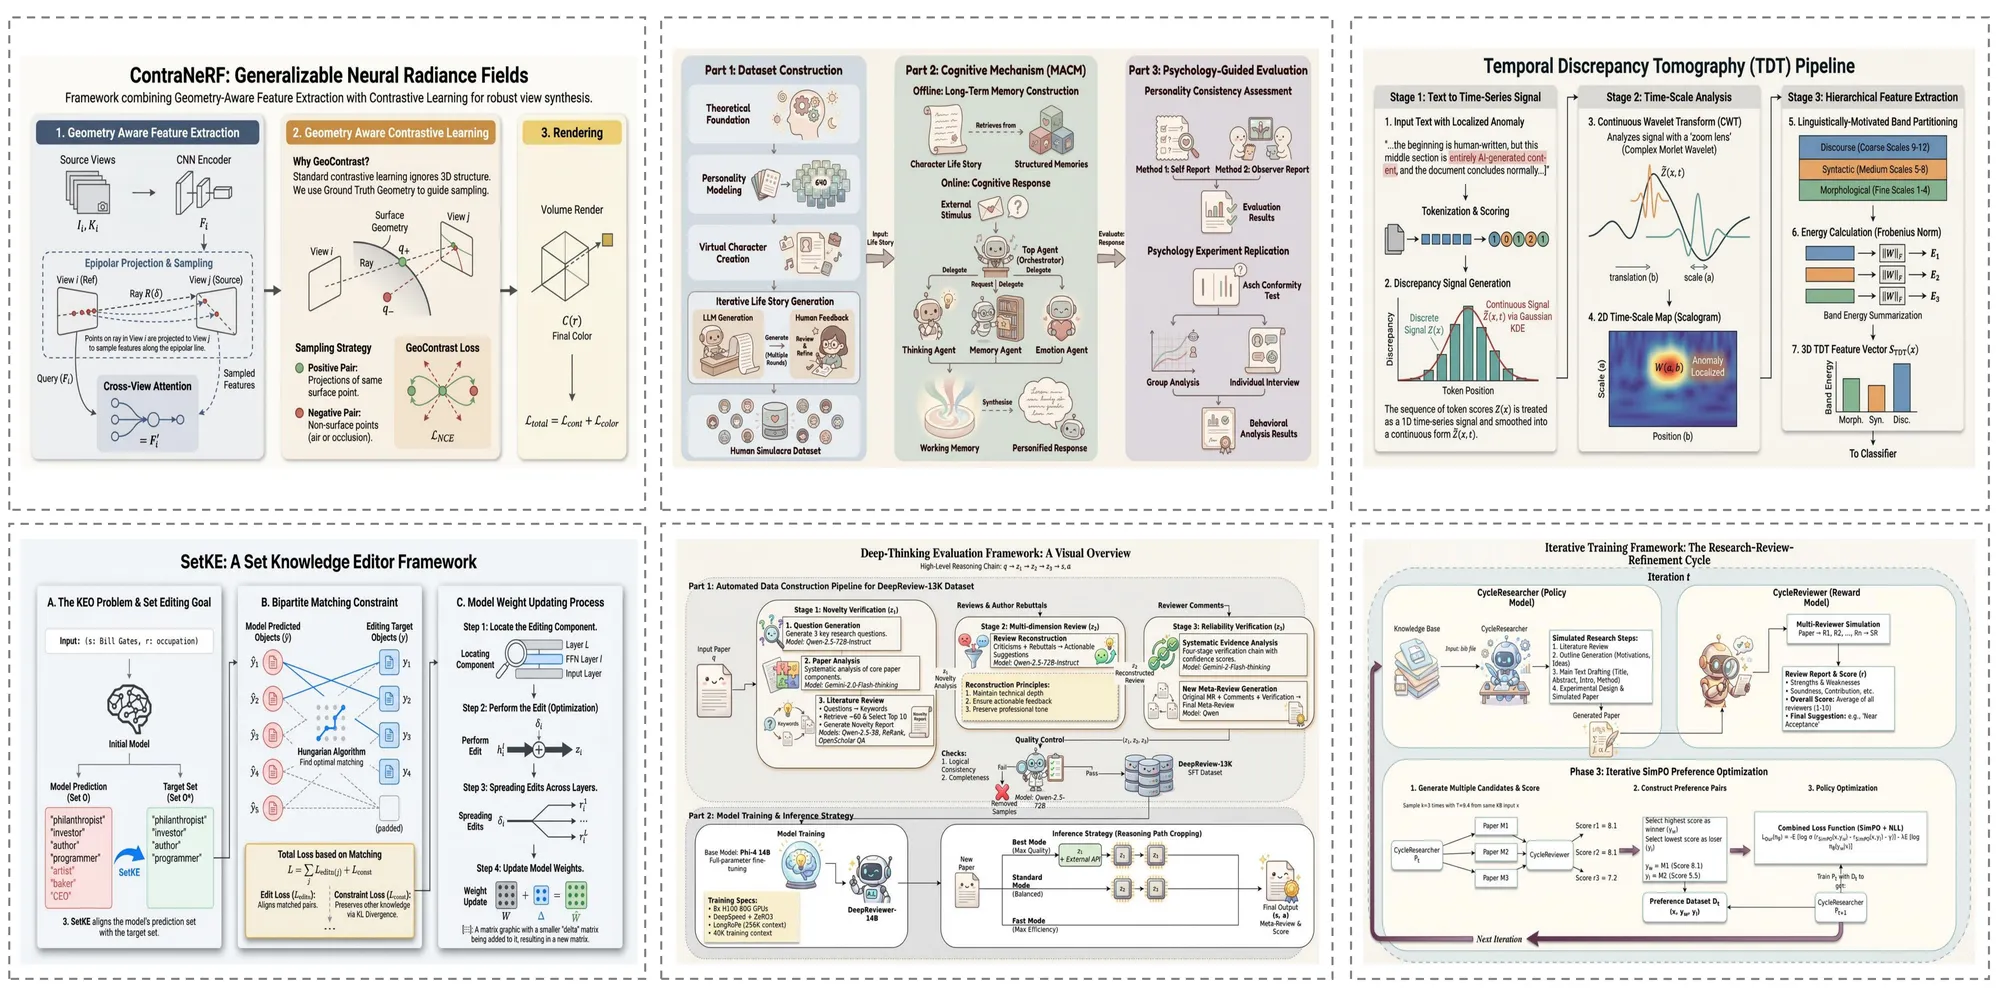
以下收錄了 AutoFigureEdit 在多個學術領域的實際生成範例,充分展現它應對不同複雜度學術插圖的卓越適應能力。
論文案例
Auto Figure 直接從研究論文文本生成出版級的方法論圖表。複雜的模型架構、多階段流水線和編碼器-解碼器框架被渲染為完全可編輯的 SVG 插圖,包含精確的形狀、連接線和標籤。
綜述案例
對於綜述論文,Auto Figure 創建全面的概覽圖,捕捉多種方法之間的分類體系、關係和對比。生成的圖表幫助讀者通過清晰的視覺層次和一致的樣式快速把握研究領域的全貌。
部落格案例
Auto Figure 同樣能處理非正式的技術寫作。從解釋機器學習概念的部落格文章到技術教程,它生成清晰且視覺吸引力強的圖表,讓複雜的想法對更廣泛的受眾易於理解。
教材案例
對於教育內容,Auto Figure 生成教材級質量的插圖,清晰傳達基礎概念。無論是神經網路架構、資料流圖還是生物過程,生成的圖表都適用於課件投影片、課程材料和教材章節。
AutoFigureEdit 解決的痛點
儘管 AI 已經能幫我們寫程式碼和推導公式,但製作「出版級」插圖仍然是手動勞作的重災區。
耗時嚴重
手動調整排版、對齊和配色可能花費數小時甚至數天的寶貴時間。
幻覺風險
通用產生模型(如 DALL-E)經常在邏輯拓撲和資料精度上出錯,產生數值幻覺。
審美鴻溝
非專業設計人員難以達到 NeurIPS、ICML、ICLR 等頂會的視覺審美要求。
Auto Figure 的核心創新
AutoFigureEdit-Edit 在自動化科研插圖生成領域引入了多項突破性創新,發表於 ICLR 2026。

系統架構:五階段流水線
Auto Figure 透過五階段流水線將科學文本轉化為可編輯的 SVG 插圖。每個階段在前一階段的基礎上建構,逐步將原始文本轉化為完全可編輯的、出版級向量插圖。
Stage 1: Raster Generation
A vision-language model (Gemini 3.1 Flash) reads your method text and optional reference image, then generates an initial raster draft (figure.png). The LLM understands scientific figure conventions and translates textual methodology into a visual composition.
Stage 2: SAM3 Segmentation
Segment Anything Model 3 (SAM3) detects and segments distinct components — icons, text regions, connectors, shapes — using structured prompts like 'icon, person, robot, animal'. Outputs bounding boxes with confidence scores and a segmentation map (samed.png).
Stage 3: SVG Templating
Using the original figure, segmentation mask, and box metadata as multimodal inputs, the LLM (Gemini 3.1 Pro) generates a placeholder-style SVG whose boxes align with labeled regions. RMBG-2.0 removes backgrounds from cropped icons to create transparent assets.
Stage 4: Final Assembly
The system aligns coordinate systems between the SVG template and original figure, then replaces placeholders with transparent icons extracted from segmentation. This produces the assembled SVG (final.svg) with all components as individually editable vector elements.
Stage 5: Iterative Refinement
An optional optimization stage performs iterative SVG refinement — path optimization, stroke recognition, and layout fine-tuning. Users can also refine the output in Auto Figure's built-in svg-edit canvas with drag-and-drop composition, completing the text-to-editable-SVG workflow.
使用者常見疑問
這裡彙整了使用者對 AutoFigureEdit 最常提出的問題及其詳盡回覆。
幾分鐘內,從論文文字到發表級配圖
使用 AutoFigureEdit 流水線,將您的方法描述轉換為可修改的 SVG 科學圖表。無需設計技能。